Chrome DevTools are consistently marching forward and providing us with helpful new features that make our lives as web designers easier. In this roundup we’ll be checking out three of the handiest recent additions. Let’s jump in!
1. Inspect and Modify CSS Variable Values
If you were using CSS variables in your CSS, up until now when you inspected your code with Chrome DevTools all you would see in the Styles tab would be something like font-size: var(--fontsize), with no indication of what that variable actually represented. To make sense of your code you’d have to find the variable name in the :root section of your CSS, look up the value, remember it, go back to the section of code you were inspecting and try to work with it from there.
Now, DevTools will compute CSS variable in the Styles tab so you can inspect their values inline, as well as see previews of colors. You’ll also be able to make modifications to your CSS variable values. Here’s how it all works.
Note: You’ll need Chrome 67 to try these features. Chromium 67 does not yet have them included.
How to Inspect Values Inline
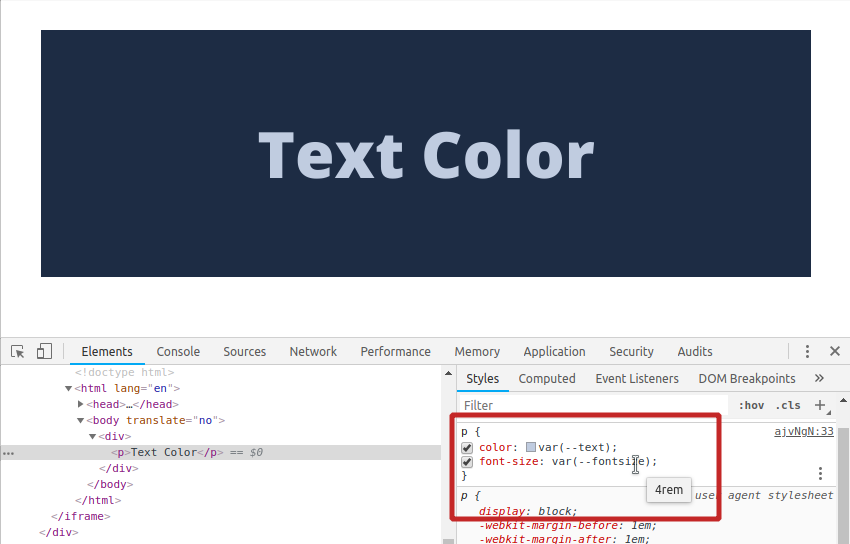
In the screenshot below you’ll see an example of the new variable inspection functionality. In the Styles tab, look at the color and font-size properties highlighted by the red box. In front of the variable var(--text) you’ll see a small colored square–this is a preview of the color defined by this variable. Below it you’ll see the mouse hovering over var(--fontsize), which makes its computed value appear in a tooltip. This hovering functionality can be used to inspect the value of any type of CSS variable.

Introducing the Variables Color Palette
The bottom section of the color picker in Chrome DevTools already gave us access to different types of color palettes, such as “Material” colors, or the colors detected as being in use by the current page. When using the color picker on CSS variables an additional palette now becomes available, one that shows you all the colors defined as variables in your style sheet.
To open the color picker, click on the little color preview square in front of a color variable. To access the list of available palettes click the toggle switch located on the right side of the palette section.

This will show you the available color palettes, one per line. Here you’ll see a line labeled “CSS Variables”, and if you hover over the colors here you’ll see a tooltip showing you the variables they represent. Select the “CSS Variables” palette by clicking on that line.

Now when you select a different color from this palette, the name of that new variable will be substituted into the code. For example, in the image below the variable name --text has been replaced by --alternative-text after clicking on a different color in the palette.

Editing Variable Values
Not only can you inspect and modify CSS variable code for individual styles, you can also do so at the root level.
Select any element, scroll down to the bottom of the Styles tab and find :root, where all your variables are defined. You can change any variable value here and the changes will be updated across your whole page.
To edit a color value, click the color preview box next to it and use the color picker. To edit other types of values, such as font sizes for example, double-click them and type in your new value.
In the example below you can see we’re using the color picker to adjust the value of the --text variable controlling our text color.

If you’d like to give this new functionality a go, we’ve setup this pen so you can use DevTools to tinker with the background color, text color and font size of a simple page:
2. Pretty Print / Format Minified Code
If you’ve ever tried to debug minified code you know it can be a painful process. Thanks to Chrome / Chromium 66 you won’t need to deal with that issue any longer, as it now has the ability to pretty print / format minified code for better readability.
To use this feature go into the Sources tab, in there go to the Page tab, then select a minified file from the list of loaded files in the left panel. This will display the file’s contents in the center window. At the bottom of this window you’ll see a pair of curly brackets {}, and if you hover over them you’ll see a tooltip that reads “Pretty print”.

Click this button and your file will be “prettily printed”, and made far more debugging friendly:

You can do the same thing for minified CSS files, but instead of the tooltip saying “Pretty print” it will say “Format”.

Click the little {} button and your CSS will become nice and readable as well:

3. Preserve Tweaks Between Reloads
Have you ever been working on some tweaks to a page via DevTools, but then needed to refresh the page and had to lose all the adjustments you’d been testing out?
As of Chrome / Chromium 65 you’ll never have that problem again, thanks to the “Local Overrides” feature. With this feature active, any tweaks you make via DevTools can be automatically saved in a local file on your hard drive, and when you refresh the page that file will be loaded in, thereby preserving your adjustments.
To turn on local overrides go to the Sources tab, and in there to the Overrides tab. If you can’t see the tab, expand the selection by clicking the >> button.

The first time you activate local overrides you’ll see a little button labeled + Select folder for overrides. As the name suggests, this will let you specify where your local override files should be saved. Hit that button and select the folder you want to use:

Once you select a folder you’ll see a security warning appear at the top of the browser. Go ahead and click Allow to proceed:

Now try making a change to a web page using DevTools, such as changing the text color on a live site for example. Refresh the page and you’ll see your color change will still be present.
If you go back into the Overrides section now you’ll see a newly added file. Assuming the tweak you made was to a text color, it will be a CSS file. This is the file that contains your local overrides, and as long as local overrides are active this file will be loaded instead of the site’s true file. Brilliant!

You can disable local overrides at any time by unchecking the Enable Local Overrides box. You can also delete individual override files from the Overrides tab, or manually through your system’s file manager.
Wrapping Up
There we have them: three great new features from Chrome DevTools that should prove super useful! CSS variables are now easier to work with, minified code can now be made readable, and using DevTools to test tweaks to sites is more powerful.
We’ll look forward to seeing what the Chrome DevTools team has in store for us next!
Powered by WPeMatico


